empty
 
 
25.07.2022 07:10 AM
EUR/USD: breaking forecast on July 25, 2022

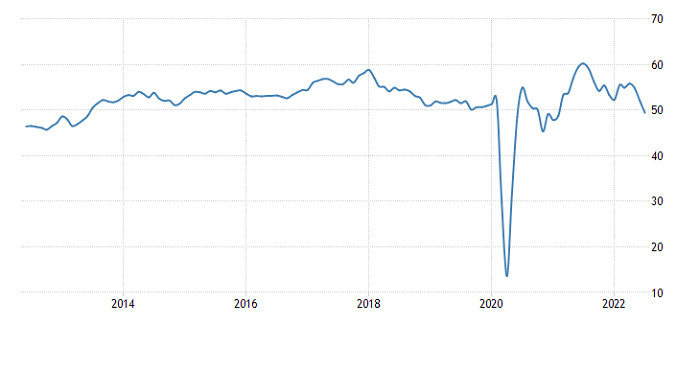
The European Central Bank has almost sent the euro into a tailspin with its decision to roll out a new bond-buying program. All hope for its growth has faded. Nevertheless, the currency somehow managed not to collapse on Friday owing to the eurozone's preliminary business activity data. The services PMI dropped to 50.6 versus 53.0. The market had expected it to come in at 52.3. The manufacturing PMI plunged to 49.6 from 52.1, missing market expectations of 51.8. The composite PMI fell to 49.4 from 52.0 in June, well below market forecasts of 51.5.

Eurozone Composite PMI:

This image is no longer relevant

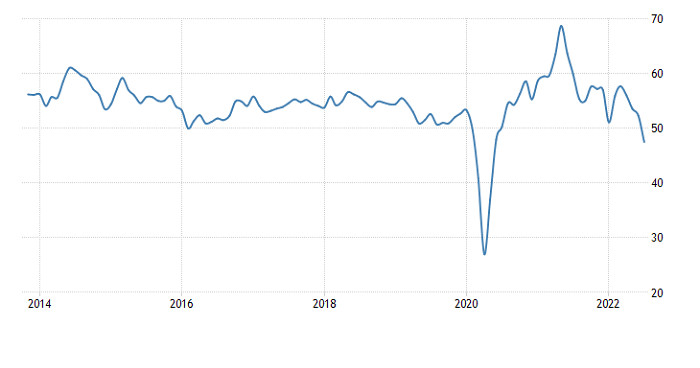
At the same time, the same flash data came in even worse in the United States. Thus, the services PMI declined to 47.0 versus 52.7, missing market expectations of 52.3. In this light, the composite PMI plummeted to 47.5 from 52.3. Economists had expected figures to fall to 52.1. The manufacturing PMI dropped to 52.3 versus 52.7, above the market consensus of 52.2. Like in Europe, two key indices came in below 50, a reading distinguishing between economic expansion and economic contraction. Likewise, the United States is heading towards a recession.

United States Composite PMI:

This image is no longer relevant

In any case, the ECB's stance on monetary policy is likely to exert pressure on the euro, pushing it towards parity with the dollar. In the coming days, the market may well be flat. Investors are awaiting the release of the FOMC meeting. Therefore, any significant changes in the markets are not expected at least until Wednesday.

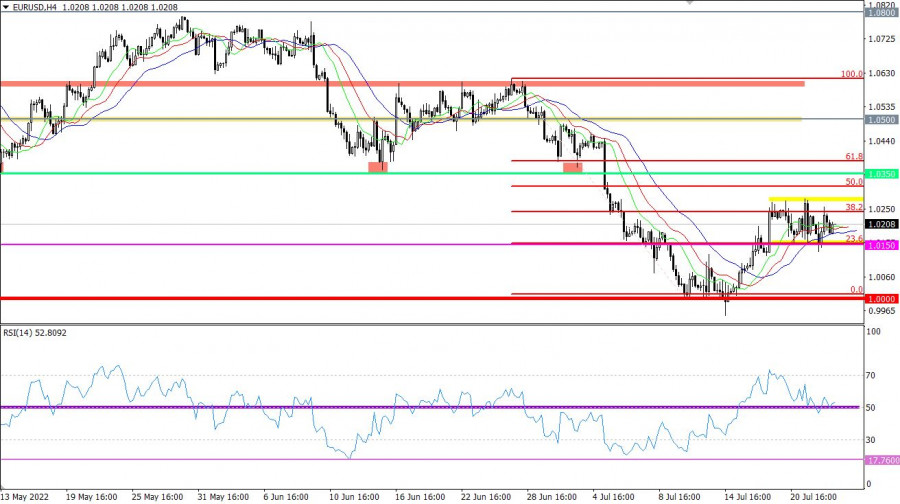
EUR/USD now trades sideways in the range between 1.0150 and 1.0270. The pair's prolonged stay within the range shows uncertainty in the market. Still, it may lead to an accumulation stage and price fluctuations.

The RSI technical indicator is moving along line 50 on the H1 and H4 charts, confirming a flat. On the daily chart, the indicator is still moving down in the 30/50 range, indicating the continuation of the downtrend.

Multiple crossovers of the Alligator's MAs show a flat market on charts H1 and H4. On the daily chart, there is no crossover of the Alligator's MAs.

This image is no longer relevant

Outlook

The current trading strategy is still to get out of the sideways range by breaking one of its limits. In this light, long positions could be opened after consolidation above 1.0280 on the H4 chart, and short positions could be considered after consolidation below 1.0115 on the same chart.

In terms of complex analysis, technical indicators give a mixed signal for short-term and intraday trading due to the flat market. In the medium term, there is a sell signal due to the downtrend.

Dean Leo,
الخبير التحليلي لدى شركة إنستافوركس
© 2007-2024
كسب عائد من تغيرات أسعار العملات المشفرة مع إنستافوركس.
قم بتحميل منصة التداول ميتاتريدر 4 وافتح أول صفقة.
  • Grand Choice
    Contest by
    InstaForex
    InstaForex always strives to help you
    fulfill your biggest dreams.
    انضم إلى المسابقة
  • إيداع الحظ
    قم بإيداع 3,000 دولار في حسابك واحصل على $8,000 وأكثر من ذالك!
    في مايو نحن نقدم باليانصيب $8,000 ضمن حملة إيداع الحظ!
    احصل على فرصة للفوز من خلال إيداع 3,000 دولار في حساب تداول. بعد أن استوفيت هذا الشرط، تصبح مشاركًا في الحملة.
    انضم إلى المسابقة
  • تداول بحكمة، اربح جهازا
    قم بتعبئة حسابك بمبلغ لا يقل عن 500 دولار ، واشترك في المسابقة ، واحصل على فرصة للفوز بأجهزة الجوال.
    انضم إلى المسابقة
  • بونص 100٪
    فرصتك الفريدة للحصول على بونص 100٪ على إيداعك
    احصل على بونص
  • بونص 55٪
    تقدم بطلب للحصول على بونص 55٪ على كل إيداع
    احصل على بونص
  • بونص 30٪
    احصل على بونص 30٪ في كل مرة تقوم فيها بتعبئة حسابك
    احصل على بونص

المقالات الموصى بها

لا تستطيع التحدث الآن؟
اطرح سؤالك في الدردشة.
Widget callback