empty
 
 
25.07.2022 07:10 AM
EUR/USD: breaking forecast on July 25, 2022

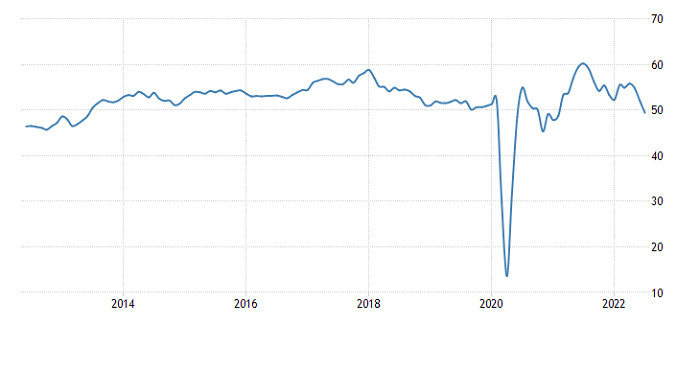
The European Central Bank has almost sent the euro into a tailspin with its decision to roll out a new bond-buying program. All hope for its growth has faded. Nevertheless, the currency somehow managed not to collapse on Friday owing to the eurozone's preliminary business activity data. The services PMI dropped to 50.6 versus 53.0. The market had expected it to come in at 52.3. The manufacturing PMI plunged to 49.6 from 52.1, missing market expectations of 51.8. The composite PMI fell to 49.4 from 52.0 in June, well below market forecasts of 51.5.

Eurozone Composite PMI:

This image is no longer relevant

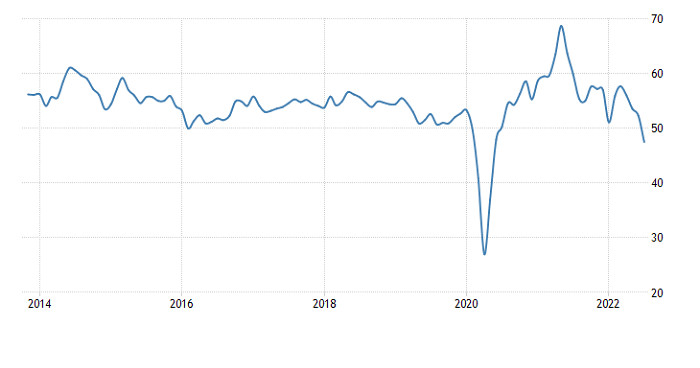
At the same time, the same flash data came in even worse in the United States. Thus, the services PMI declined to 47.0 versus 52.7, missing market expectations of 52.3. In this light, the composite PMI plummeted to 47.5 from 52.3. Economists had expected figures to fall to 52.1. The manufacturing PMI dropped to 52.3 versus 52.7, above the market consensus of 52.2. Like in Europe, two key indices came in below 50, a reading distinguishing between economic expansion and economic contraction. Likewise, the United States is heading towards a recession.

United States Composite PMI:

This image is no longer relevant

In any case, the ECB's stance on monetary policy is likely to exert pressure on the euro, pushing it towards parity with the dollar. In the coming days, the market may well be flat. Investors are awaiting the release of the FOMC meeting. Therefore, any significant changes in the markets are not expected at least until Wednesday.

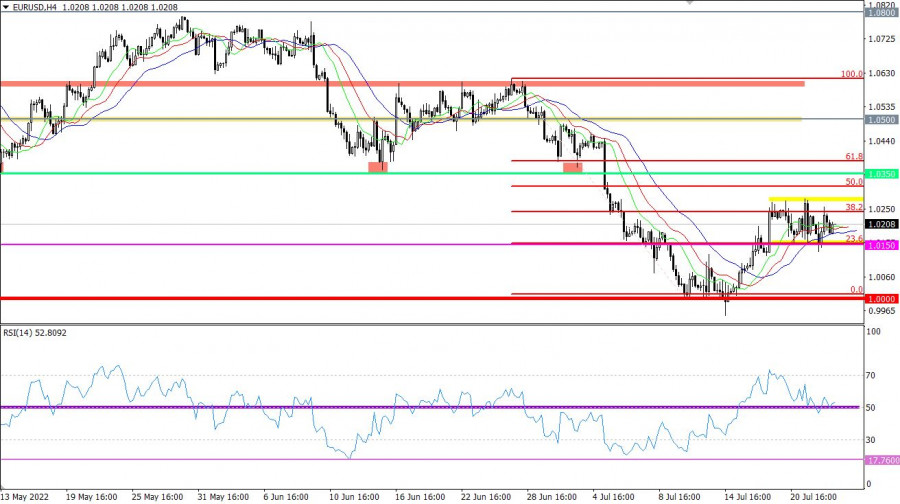
EUR/USD now trades sideways in the range between 1.0150 and 1.0270. The pair's prolonged stay within the range shows uncertainty in the market. Still, it may lead to an accumulation stage and price fluctuations.

The RSI technical indicator is moving along line 50 on the H1 and H4 charts, confirming a flat. On the daily chart, the indicator is still moving down in the 30/50 range, indicating the continuation of the downtrend.

Multiple crossovers of the Alligator's MAs show a flat market on charts H1 and H4. On the daily chart, there is no crossover of the Alligator's MAs.

This image is no longer relevant

Outlook

The current trading strategy is still to get out of the sideways range by breaking one of its limits. In this light, long positions could be opened after consolidation above 1.0280 on the H4 chart, and short positions could be considered after consolidation below 1.0115 on the same chart.

In terms of complex analysis, technical indicators give a mixed signal for short-term and intraday trading due to the flat market. In the medium term, there is a sell signal due to the downtrend.

Dean Leo,
Chuyên gia phân tích của InstaForex
© 2007-2024
Kiếm lợi nhuận từ những biến đổi giá của tiền điện tử với InstaForex.
Tải MetaTrader 4 và mở giao dịch đầu tiên của bạn.
  • Grand Choice
    Contest by
    InstaForex
    InstaForex always strives to help you
    fulfill your biggest dreams.
    THAM GIA CUỘC THI
  • Tiền gửi lần truy cập
    Ký quỹ tài khoản của bạn với $3000 và nhận được $9000 nhiều hơn!
    Trong Tháng 5 chúng tôi xổ $9000 trong chiến dịch Chancy Deposit!
    Có được một cơ hội giành chiến thắng bằng việc ký quỹ $3000 vào một tài khoản giao dịch. Đáp ứng được điều kiện này, bạn trở thành một người tham gia chiến dịch.
    THAM GIA CUỘC THI
  • Giao dịch khôn ngoan, thành công
    Nạp tiền vào tài khoản của bạn với ít nhất $ 500, đăng ký cuộc thi và có cơ hội giành được các thiết bị di động.
    THAM GIA CUỘC THI
  • 100% tiền thưởng
    Cơ hội duy nhất của bạn để nhận 100% tiền thưởng khi gửi tiền
    NHẬN THƯỞNG
  • 55% Tiền thưởng
    Đăng ký tiền thưởng 55% cho mỗi lần gửi tiền của bạn
    NHẬN THƯỞNG
  • 30% tiền thưởng
    Nhận 30% tiền thưởng mỗi khi bạn nạp tiền vào tài khoản của mình
    NHẬN THƯỞNG

Các bài báo được đề xuất

Không thể nói chuyện ngay bây giờ?
Đặt câu hỏi của bạn trong phần trò chuyện.
Widget callback